Introduction
The mocks are described here and the shears are described here These measurements use the shears from the ray tracing. There is no shape noise, only noise from multiple deflection and the computational limitations of the ray tracing.The lens catalog is simply the halo catalog for the simulations. There are none of the additional complications introduced by galaxy cluster finding.
We need to work on a limited range of scales. First recall that we need to fit two components: an NFW term and a term to account for correlated structure, the linear bias term, A.K.A. the two-halo term.
We can't use radii less than 100kpc due to resolution issues. Also we cannot use radii larger than about 10Mpc, which normally would be important for constraining the two-halo term. This is because Matt has temporarily been using small patches of the simulation for calculating the shear. This issue has been discussed previously on the mailing list. It isn't simple how this convert the effect to physical radius in these plots, but 10Mpc seems to work well. So all fits are currently restricted to 0.1-10Mpc. (NOTE: It has come to my attention we should actually be using a 200kpc limit for the current ray tracing code)
The technique used here is the same as that in Sheldon et al. 2009a, Sheldon et al. 2009b, and Johnston et al.
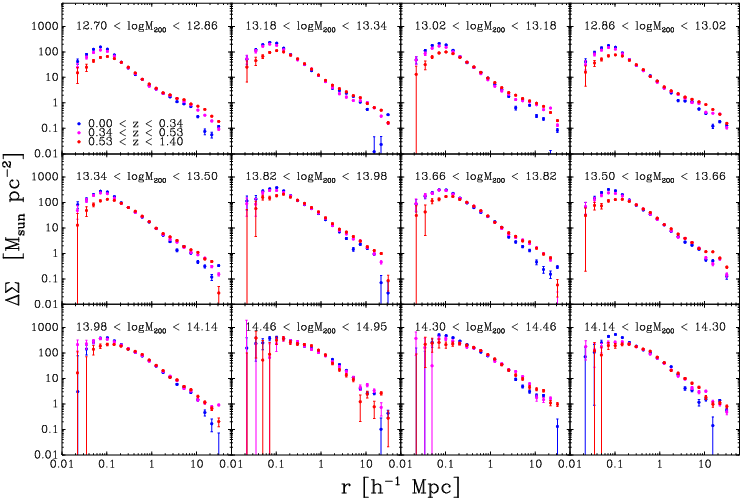
Delta Sigma in Mass and Redshift Bins
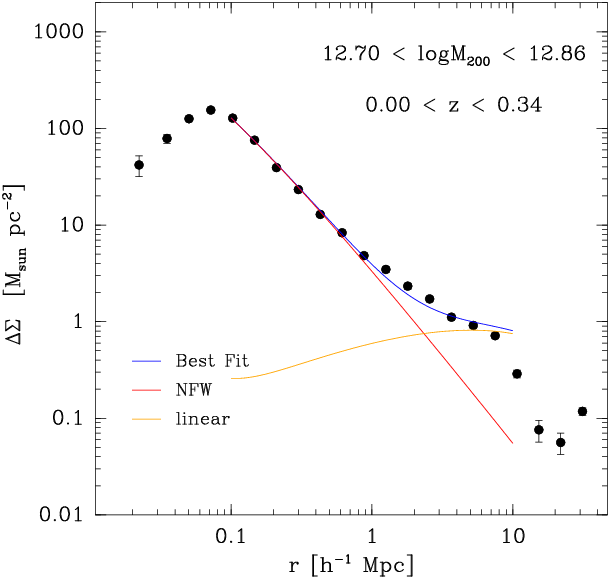
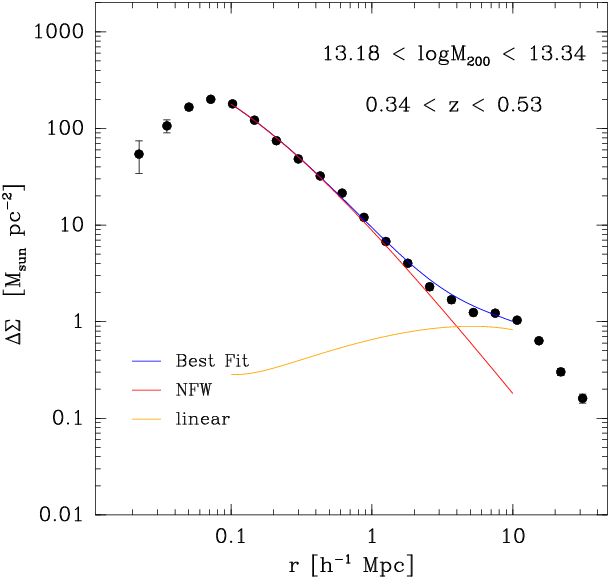
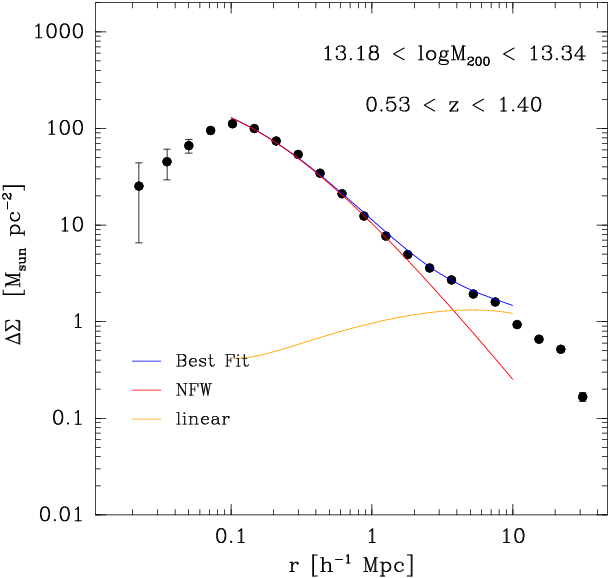
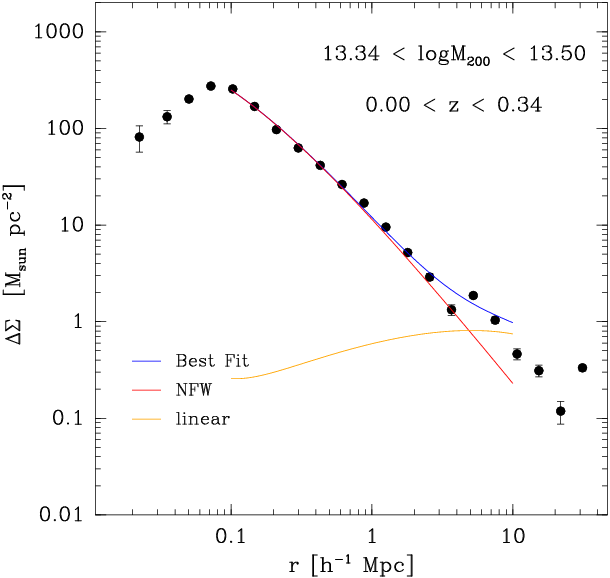
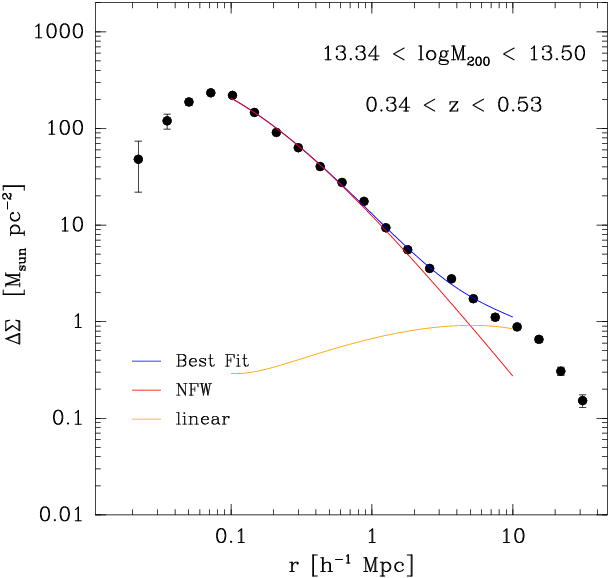
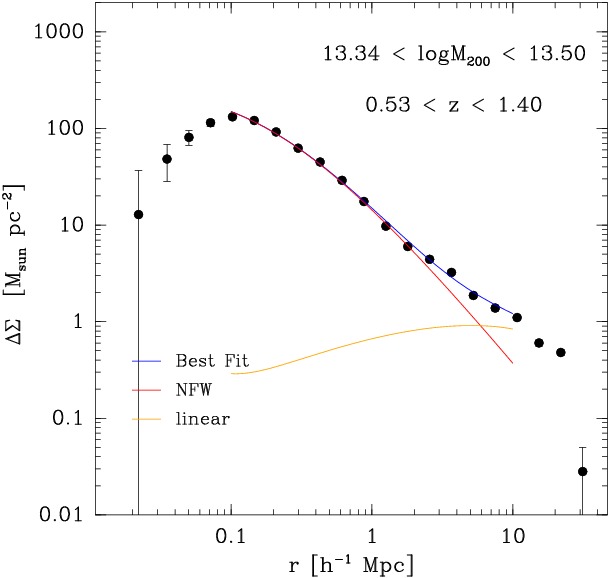
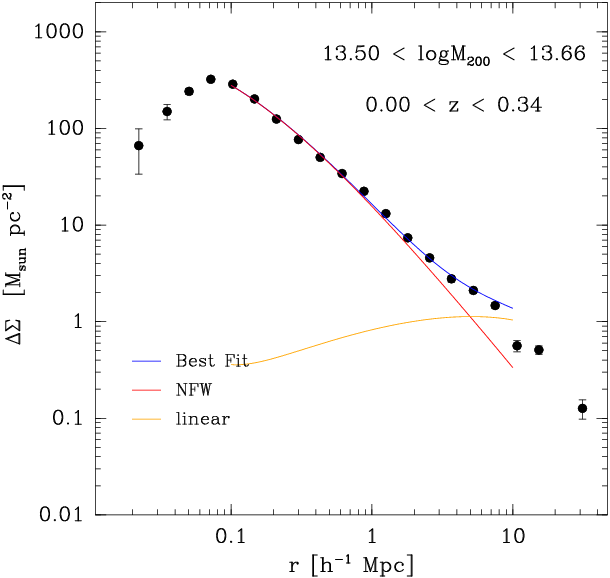
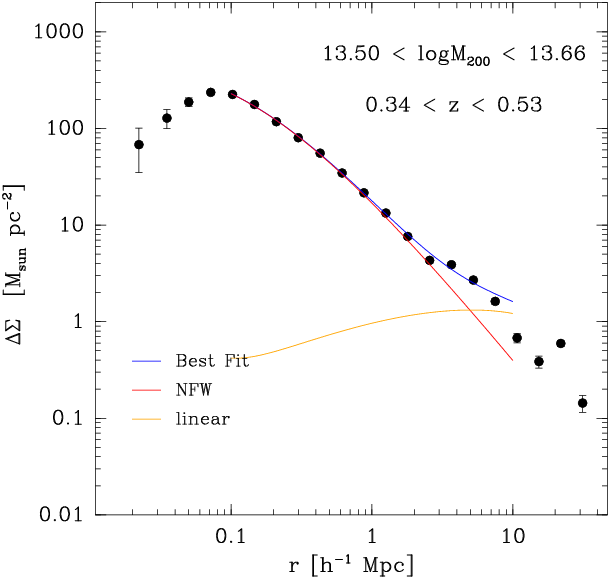
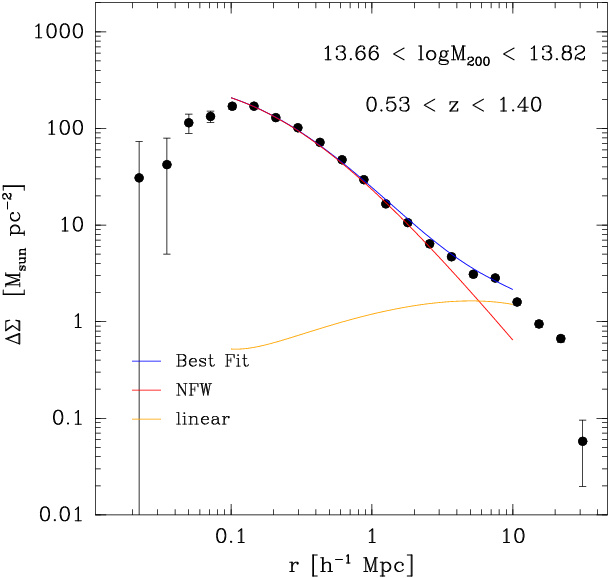
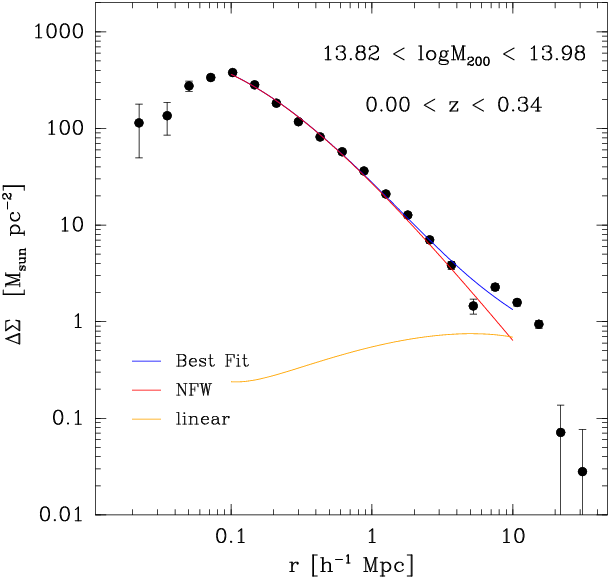
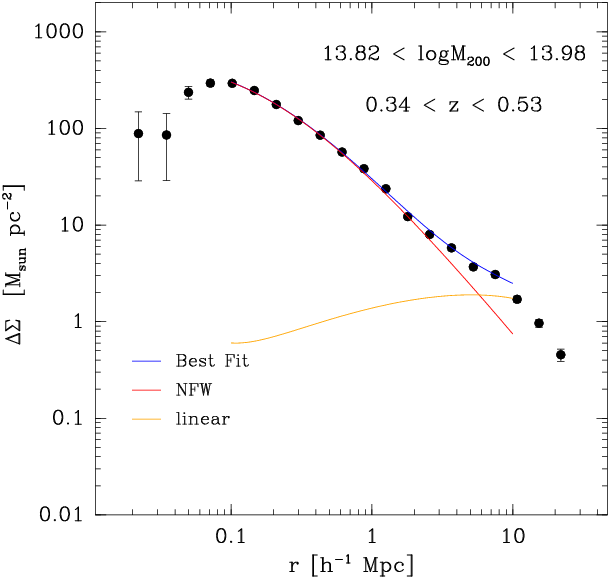
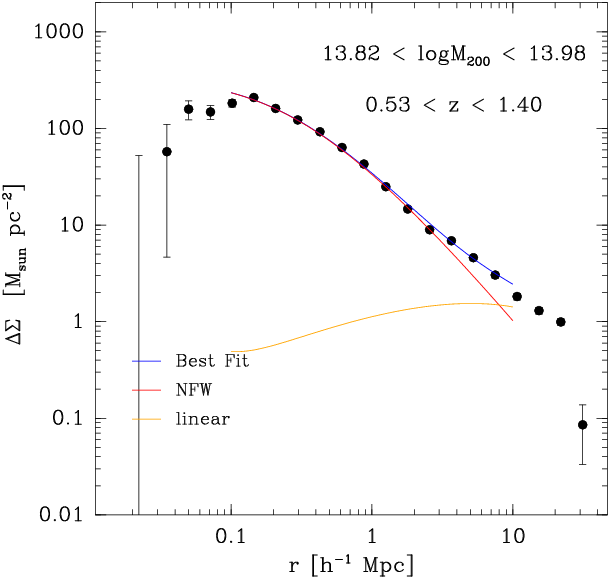
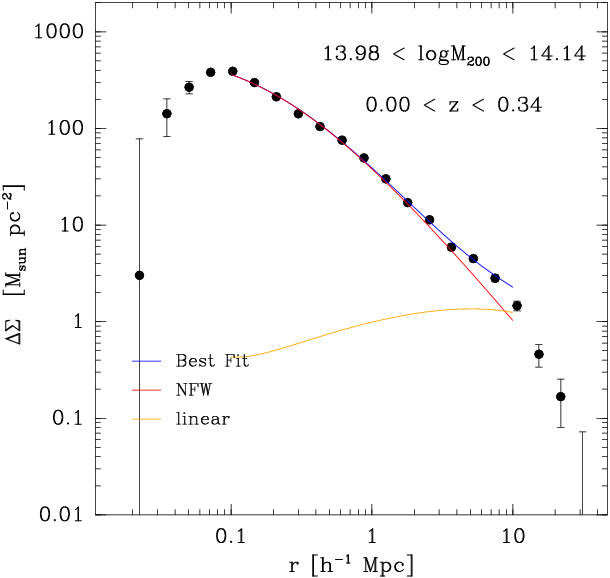
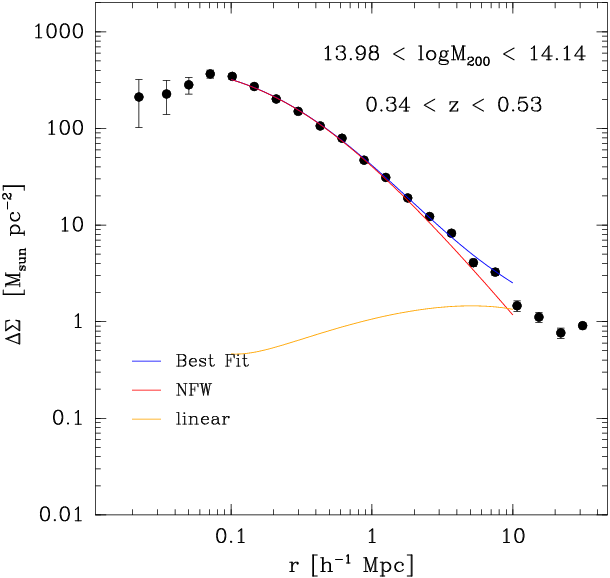
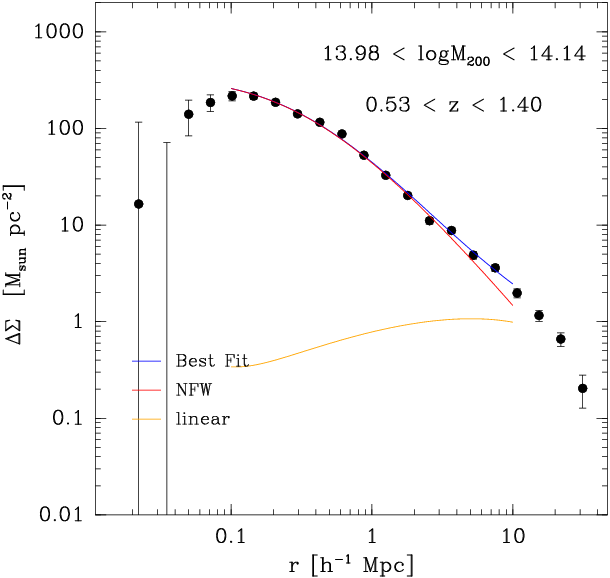
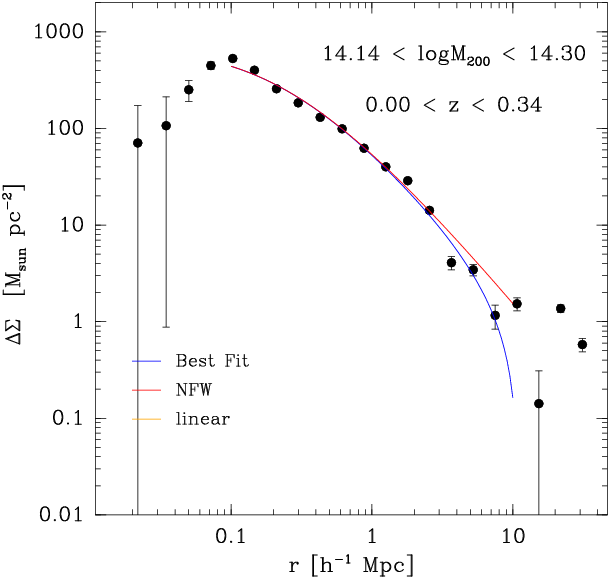
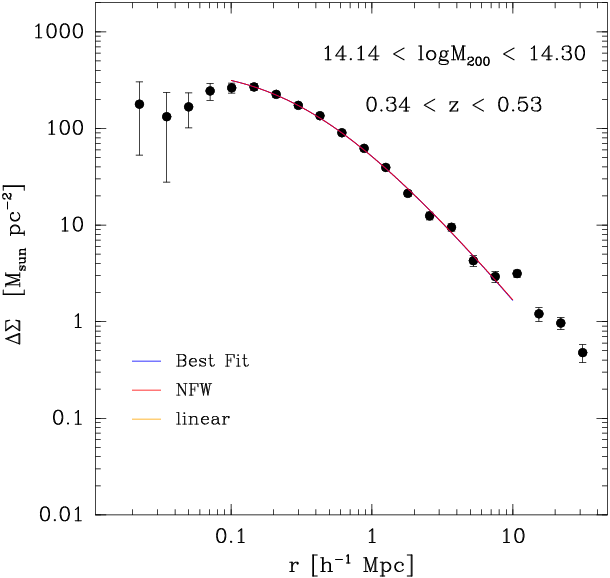
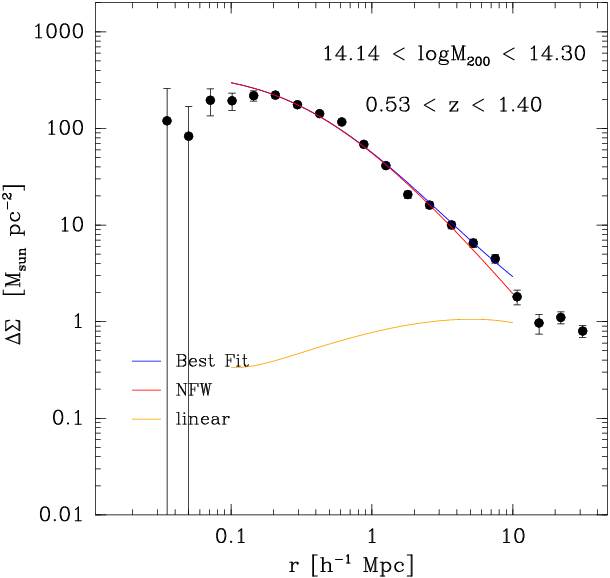
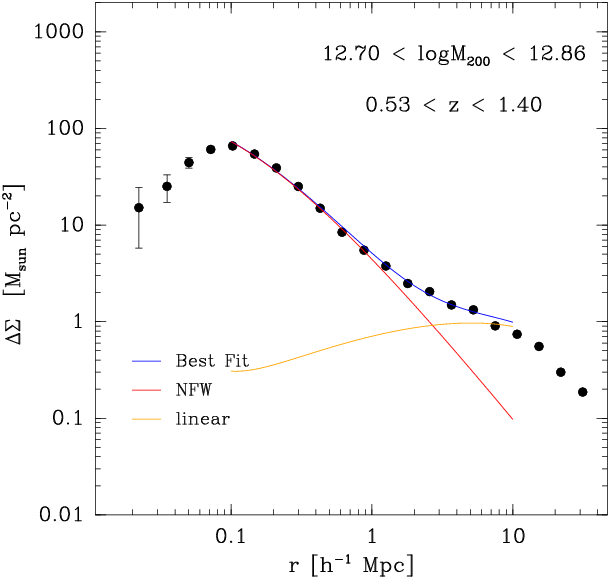
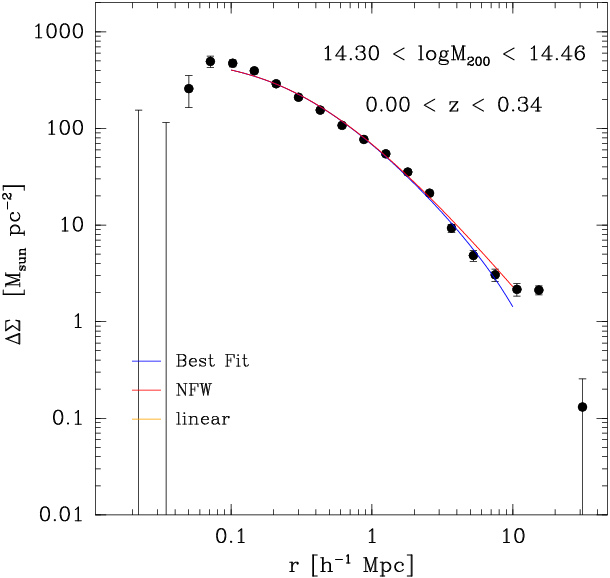
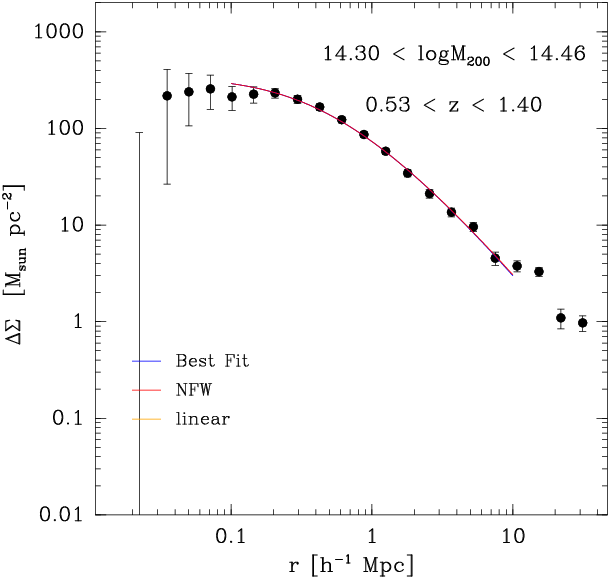
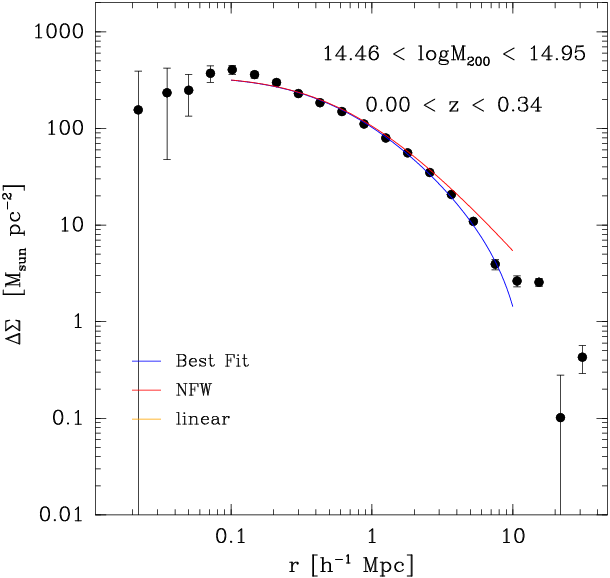
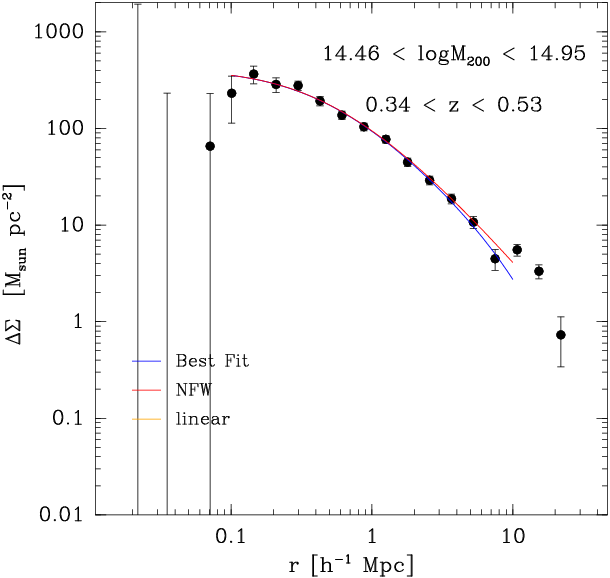
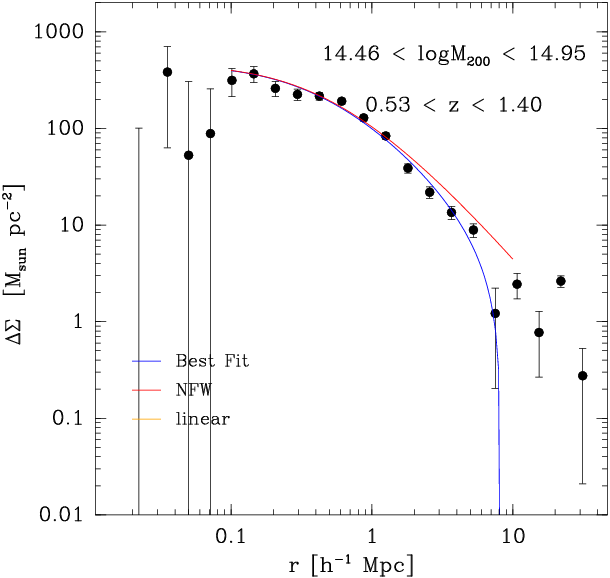
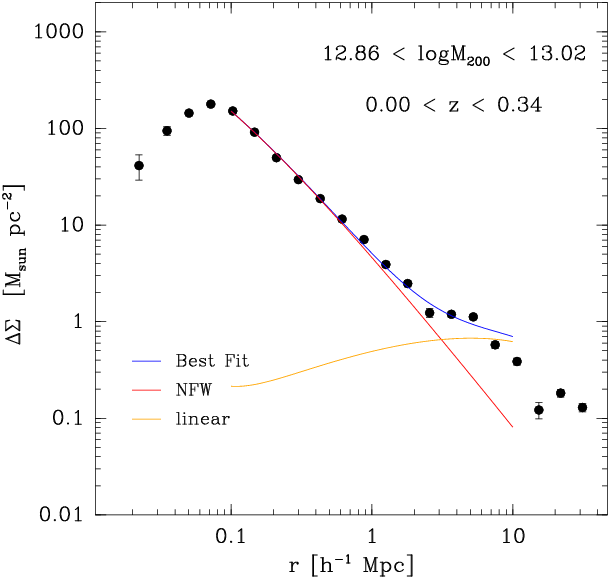
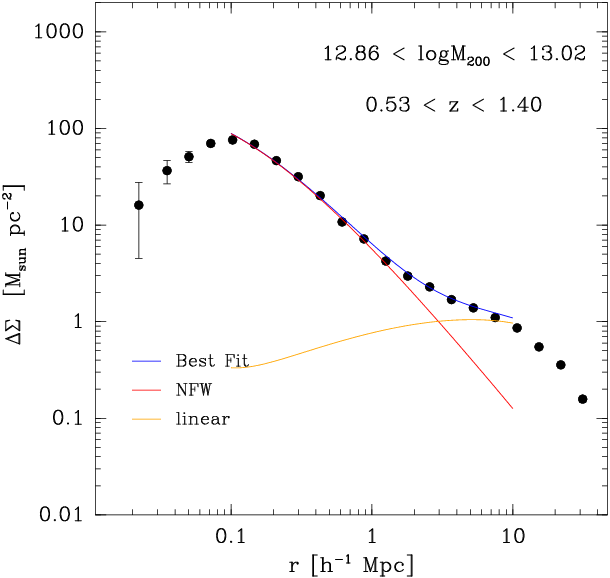
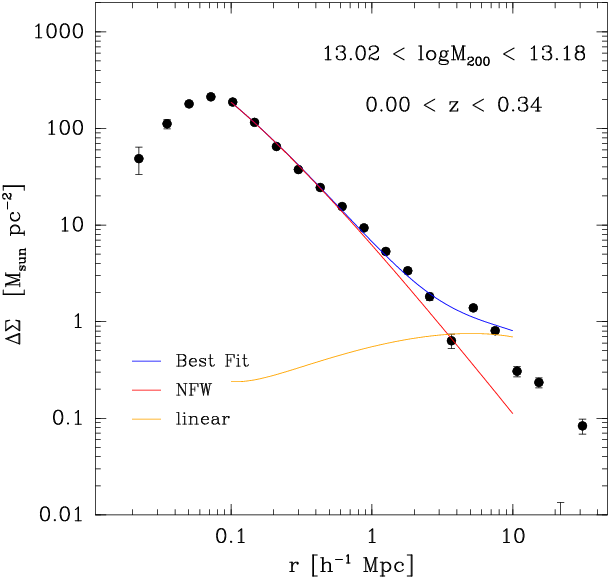
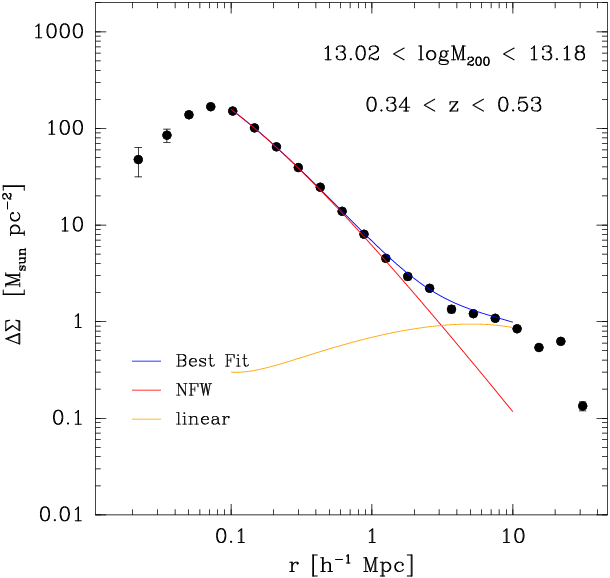
This plot shows the DeltaSigma(r) for each bin bin redshift and mass. Errors assume typical shape noise, even though there is none in these data. The turnover at small scales is due to resolution effects in the simulation. The rapid dropoff at large scales in some bins is due to the above mentioned effect at large scales.
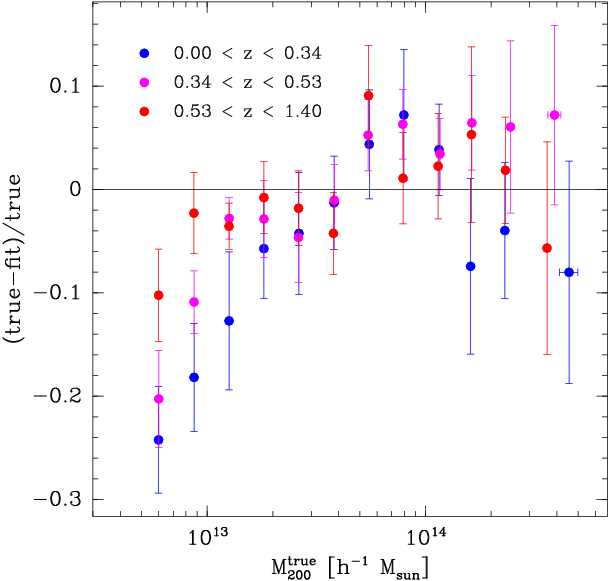
Recovered M200
The recovered M200 vs the true M200. The recovered mass is less accurate for small masses. It may be that the lower mass halos are more affected by resolution issues. It is not clear how badly the issues at large scale may affect the masses.

The residuals between the fit and the truth.
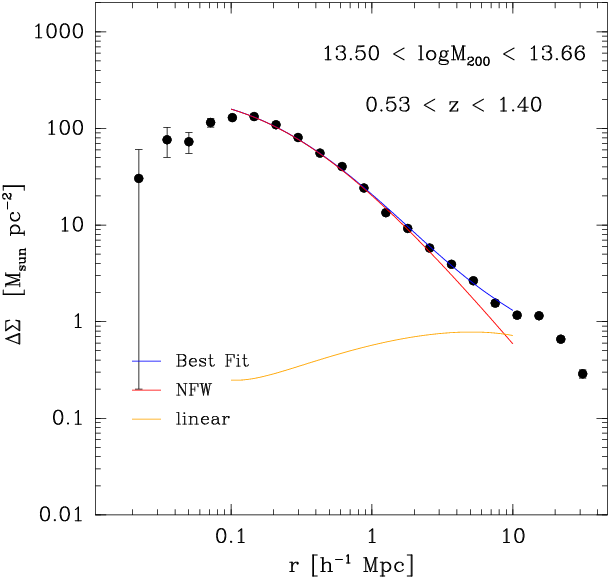
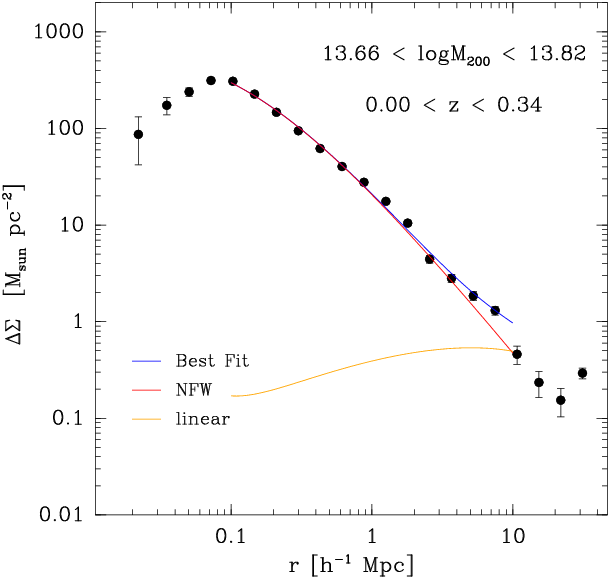
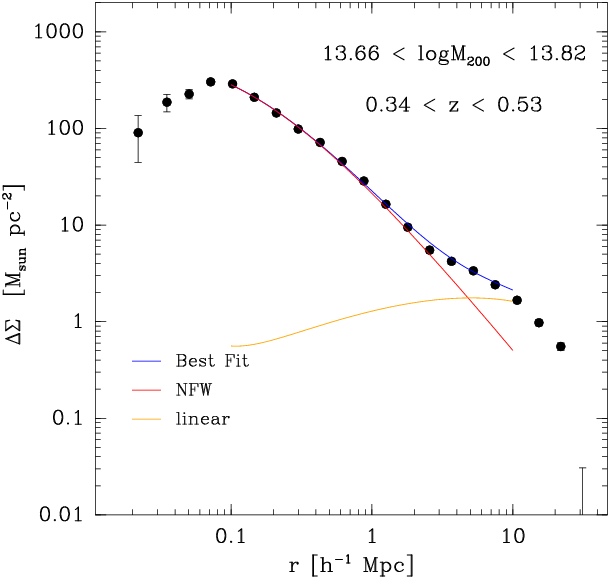
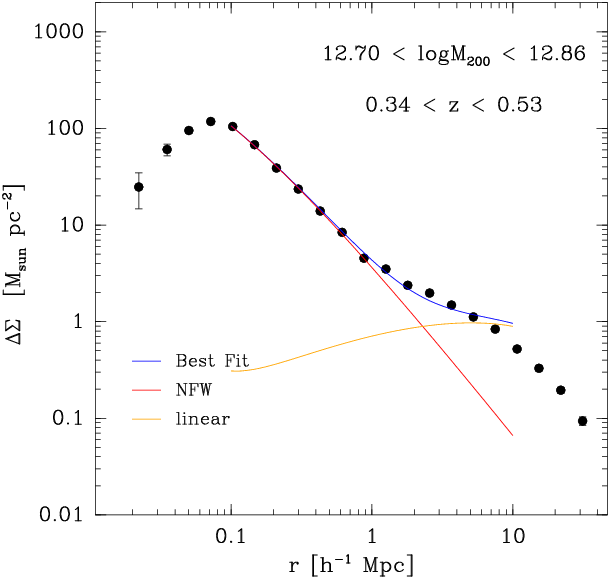
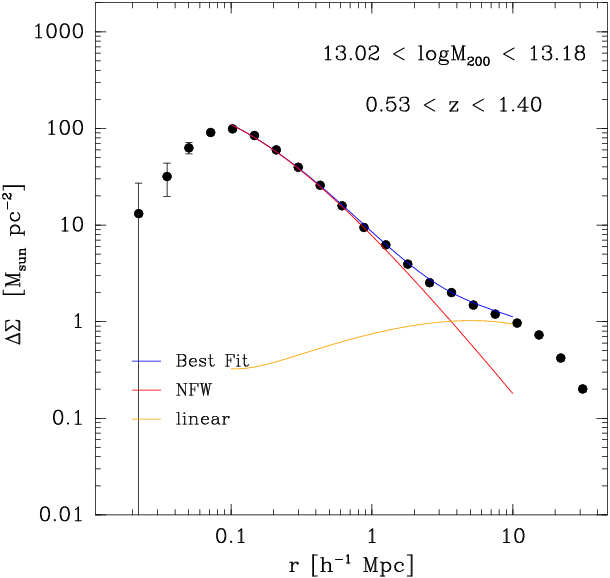
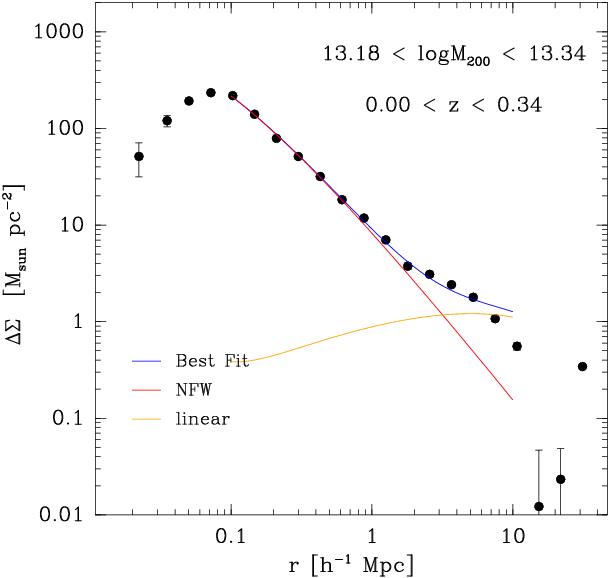
NFW + Two Halo Term FITS
These plots show the fits for an NFW profile plus a linear term times bias. The linear term is computed from the linear power spectrum (Eisenstein and Hu). Note how the linear term is not a good representation at large scales due to the issue in the shear catalog mentioned in the introduction above. Points at very large radius were not used in the fit for this reason.Also, the points at less than 100 kpc were not used in the fit to avoid resolution issues.